Fernandina has one of America's oldest tide gauges. Here's the number it has been telling you since 1897.
2.31 millimeters a year, every year, for 129 years. Not a model. A measurement — and one that every flood, insurance, and beach-money story in this county should start from.
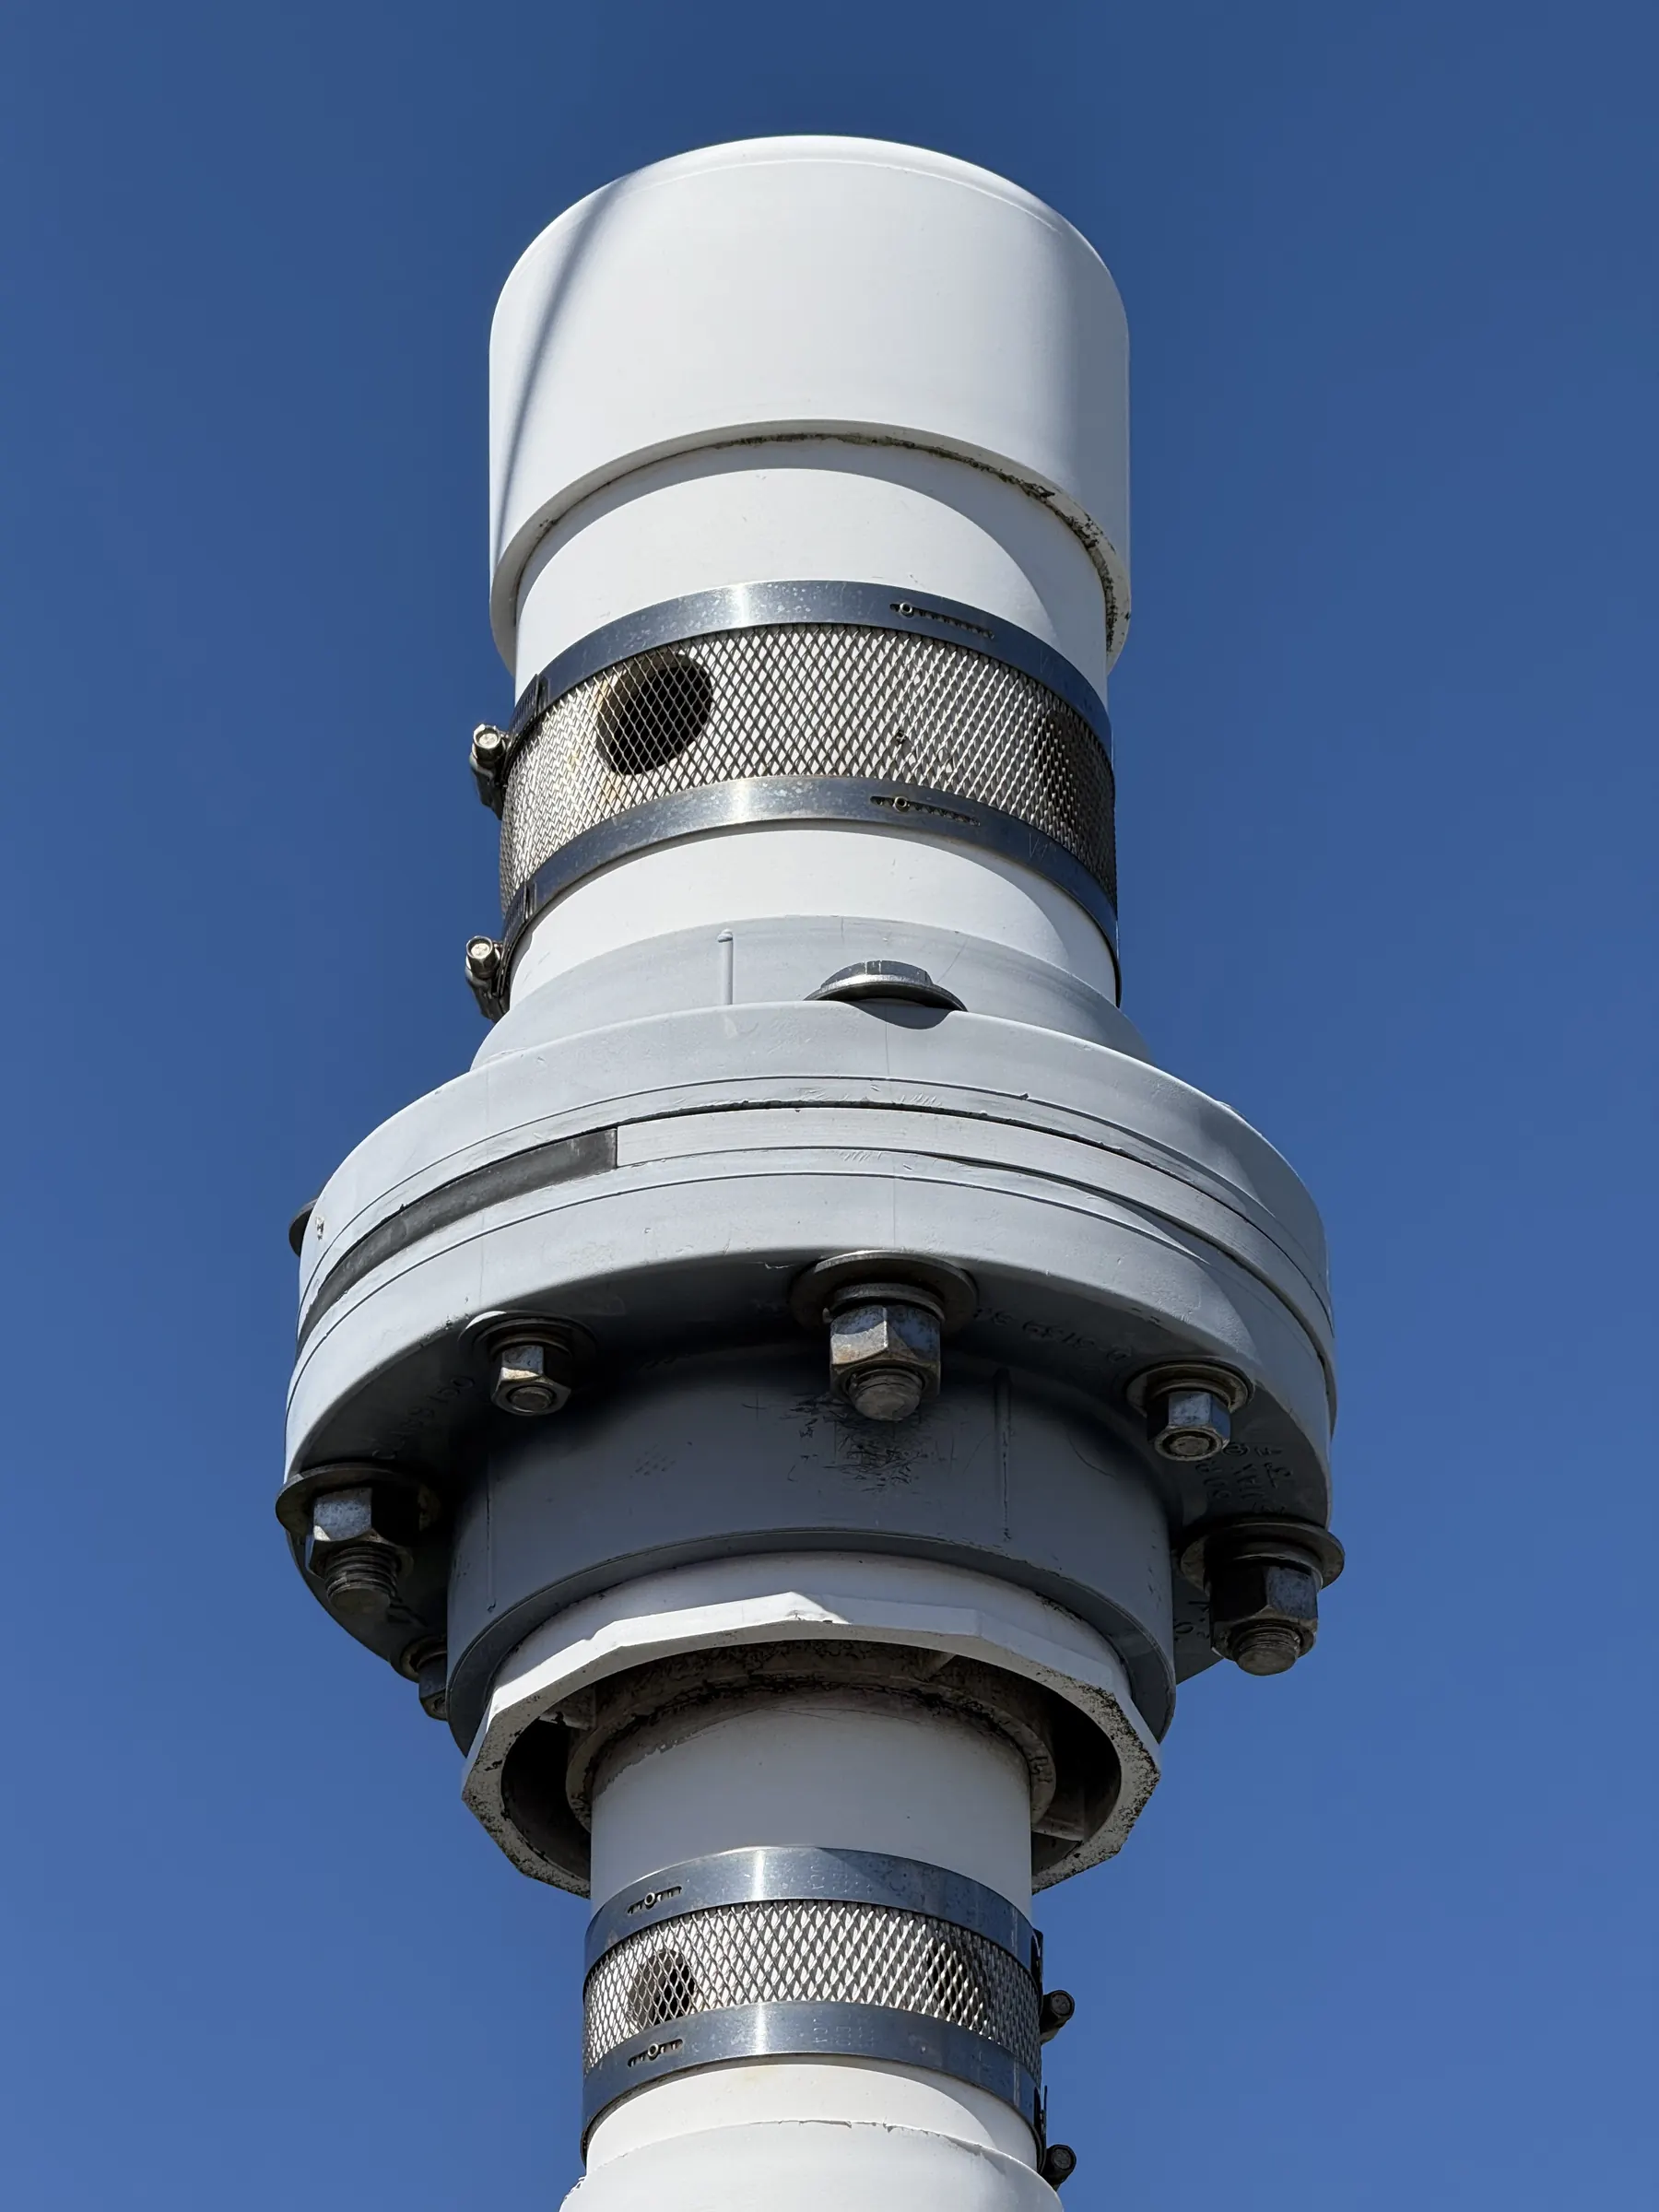
Photo: Famartin, CC BY-SA 4.0, via Wikimedia Commons. A USGS gauge in Absecon, N.J. — the same class of instrument as NOAA station 8720030.
Why nowNOAA's 2026 high-tide flooding outlook for Fernandina posted in June. Hurricane season peaks in September.
At the Fernandina Beach waterfront, NOAA station 8720030 has been recording the height of the Atlantic Ocean since 1897. It is one of the longest continuously operating tide gauges in the United States. Local coverage mentions that fact regularly, usually as a point of civic pride.
What the coverage almost never mentions is the number the gauge produces.
The number
NOAA’s official sea level trends file gives the relative sea level trend at Fernandina Beach as 2.31 millimeters per year, plus or minus 0.17 millimeters at 95% confidence, computed from monthly mean sea levels between 1897 and 2025 — 129 years, 88% complete.1
We downloaded NOAA’s raw monthly-mean file for the station and recomputed the slope ourselves. We got the same answer.
2.31 millimeters a year is about 9.1 inches per century. Over the life of the gauge, that is roughly a foot of relative rise — “relative” because the figure captures both the ocean rising and the land, very slightly, settling. For a homeowner, an insurer, or a city engineer, the distinction is academic. The water is where it is.
Why the number lives in the dark
The trend value sits in a JavaScript-rendered table on the NOAA station page. If you load that page with a scraper or a screen reader, you get a placeholder where the number should be. Reporters working on deadline see “one of the longest gauges in America” in a press release and never pull the CSV.2 The result is a county whose coastal debates — beach renourishment, the downtown seawall, flood insurance rates, the marsh-side neighborhoods — are conducted almost entirely with statewide or national figures, when the most precise local measurement in the state of Florida is sitting 200 yards from City Hall.
What the gauge says about flooding right now
NOAA also counts “high-tide flood days” at each station — days when water reaches a minor-flooding threshold without a storm. At Fernandina the recent counts are 9 days in the 2022 meteorological year, 10 in 2023, 9 in 2024, and 7 in 2025. NOAA’s outlook for the year running May 2026 through April 2027 is 6 to 9 days.3
Two things are true at once. The 2023 count exceeded NOAA’s own prediction for that year. And the numbers are single digits, not the dozens that some regional coverage implies. Anyone telling you downtown Fernandina floods constantly is wrong. Anyone telling you it doesn’t flood without a hurricane is also wrong. It floods on sunny days about once a month, on the highest tides, and it did not do that in 1950.
The floor, not the forecast
Here is where a responsible reader should push back on us, and we’ll do it first. A 129-year straight line is the most conservative possible way to describe this. NOAA’s 2022 scenario report projects the Southeast Atlantic coast at 1.2 to 1.4 feet of rise by 2050 relative to a 2000 baseline — a pace several times the long-run average, because the last few decades curve upward.4 If you’re pricing a 30-year mortgage on the marsh side, the linear number is your floor. It is not your planning case.
But the floor is exactly what this county has never written down. Every argument about the seawall, the federal beach project, the flood maps, the CRS rating, and the FEMA base flood elevation should begin with the same sentence: Fernandina’s own gauge says 2.31 millimeters a year, and rising. Then argue about what comes next.
We’ll use that number in every coastal story we publish. Hold us to it.
Where we could be wrong
A 129-year linear trend is the most conservative possible framing. NOAA's own scenario work for the Southeast Atlantic projects 1.2 to 1.4 feet of rise by 2050 relative to 2000 — a rate several times the long-run linear slope — because the recent decades bend upward. Anchoring readers to 'nine inches a century' could understate what the next 25 years actually look like. On the other side: relative sea level at this gauge includes land subsidence and local effects, so the number is not purely 'the ocean rising,' and high-tide flood counts at this station have run at 7 to 10 days a year, not the dozens some coverage implies. Both objections are fair. The linear number is the floor, not the forecast.
Confidence levels, sourcing rules, and how we handle errors: Methodology. Spot a mistake? Email corrections — we fix it at the top of the post within 24 hours.
The number nobody else in Nassau County has, in your inbox before the meeting.
Sourced, linked, corrected in public. Unsubscribe with one click; we'd rather have 500 readers who forward it than 5,000 who don't.
We never sell the list. Publisher: Amelia Undertow Media LLC.
The fee on a new Nassau County house jumps 48% next April. The AG already called it a tax in disguise.
increase in the mobility fee on a single-family home, Zone 1 (East), between April 2026 and April 2027